Graphing is an important skill for children to learn. They must be taught how to construct charts manually, however, when this is not the main focus of a lesson, a tech tool is very useful. They certainly make more time for focus on the analysis and discussion of data.

Here are 10 excellent websites/apps that make graphing in the classroom easy:
1) Plotvar.
A simple but effective website to create a range of different graphs.

2) Infogram
I particularly liked this website. It helps you construct amazing, interactive charts and graphs.

A basic but free graph maker. It is easy-to-use and gets the job done.

4)NCES
A really good graphing site made specifically for ‘kids’.

5) Chart Go
A website dedicated to creating an array of charts for any purpose.

6) Rapid Tables
This website has many online tools including a bar chart, line graph and pie chart generator.

7) Plotly
A fantastic website which helps you create a range of more complex charts.
.png/220px-Plotly_logo_for_digital_final_(6).png)
8) Img Flip
A very basic, informal pie-chart maker.

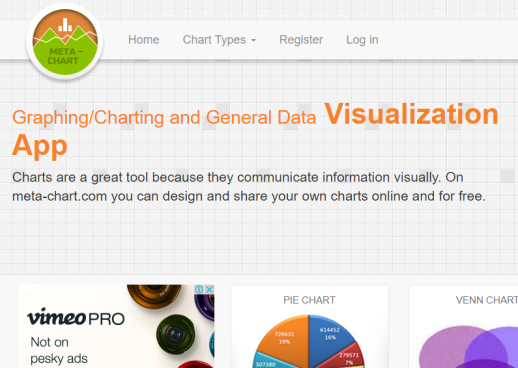
9) Meta Chart
I really liked using Meta Chart. It has just the right amount of detail needed for making graphs with my students.

10) Grapher
This is a very simple bar chart creator – perfect for younger learners.

*Update – Canva have recently brought out a superb tool 🙂
https://www.canva.com/graphs/venn-diagrams/
Which one is your favourite? Let me know by commenting below.


Do you know of a graphing tool to pruduce a line of best fit?
LikeLike
Excel can do lines of best fit. Happy to give more details if needed.
LikeLiked by 1 person
Re: excel LOBF I would love some more detials and perhaps some basic instructions. I have used excel in the past but am not an expert so some basic ‘how to get started with graphing’ in excel would be great – thanks
LikeLiked by 1 person
Yes, excel can do lines of best fit . Also, http://www.meta-calculator.com ‘s stats calculator can (I hadn’t known of that tool till I actually checked out one of the links on this post which ended up leading to this stats tool!)
LikeLike
I’m teacher in local area I would like to expose myself and my learners to the use of technology one day in class.
LikeLike
I want to create a survey/questionnaire with a single question and 6 options. I also need to create a table but for both I don’t want to use Microsoft Word or Excel because I don’t want the word count to appear in my essay. Anyone know any websites that can do this as I can only find graph making sites. The essay is for teaching year 6 students about statistics so the site has to be kid friendly.
LikeLike
There is a website caller Datawrapper which also creates beautiful but interactive graphs.
LikeLike
please consider our new site Chartle.com to add to this list
LikeLike
Try also LiveGap ( https://livegap.com/charts ) , it is a free charting tool for making line, bar, area, pie, polar area, doughnut, radar. While making charts and graphs using this online charting tool you can preview the chart or graphs with the customization options
LikeLike
“Online Chart Tool” is an excellent solution for my purposes!
Thank you for this post!
LikeLike
Vizzlo is another tool – https://vizzlo.com. They offer a broad range of different visualizations (bar, line, bubble, radar, marimekko but also gantt charts or timelines). They offer a free plan and many of our students use it for their projects.
LikeLike